So, you want to learn more about the benefits of StepSync? Below are 5 ways to up your data analytics game with IMU Step metrics and StepSync.
1. Import Step data for combined analysis in your EMR system or AMS
StepSync enables the integration of proprietary Step metrics and meta data into your preferred data management platform.
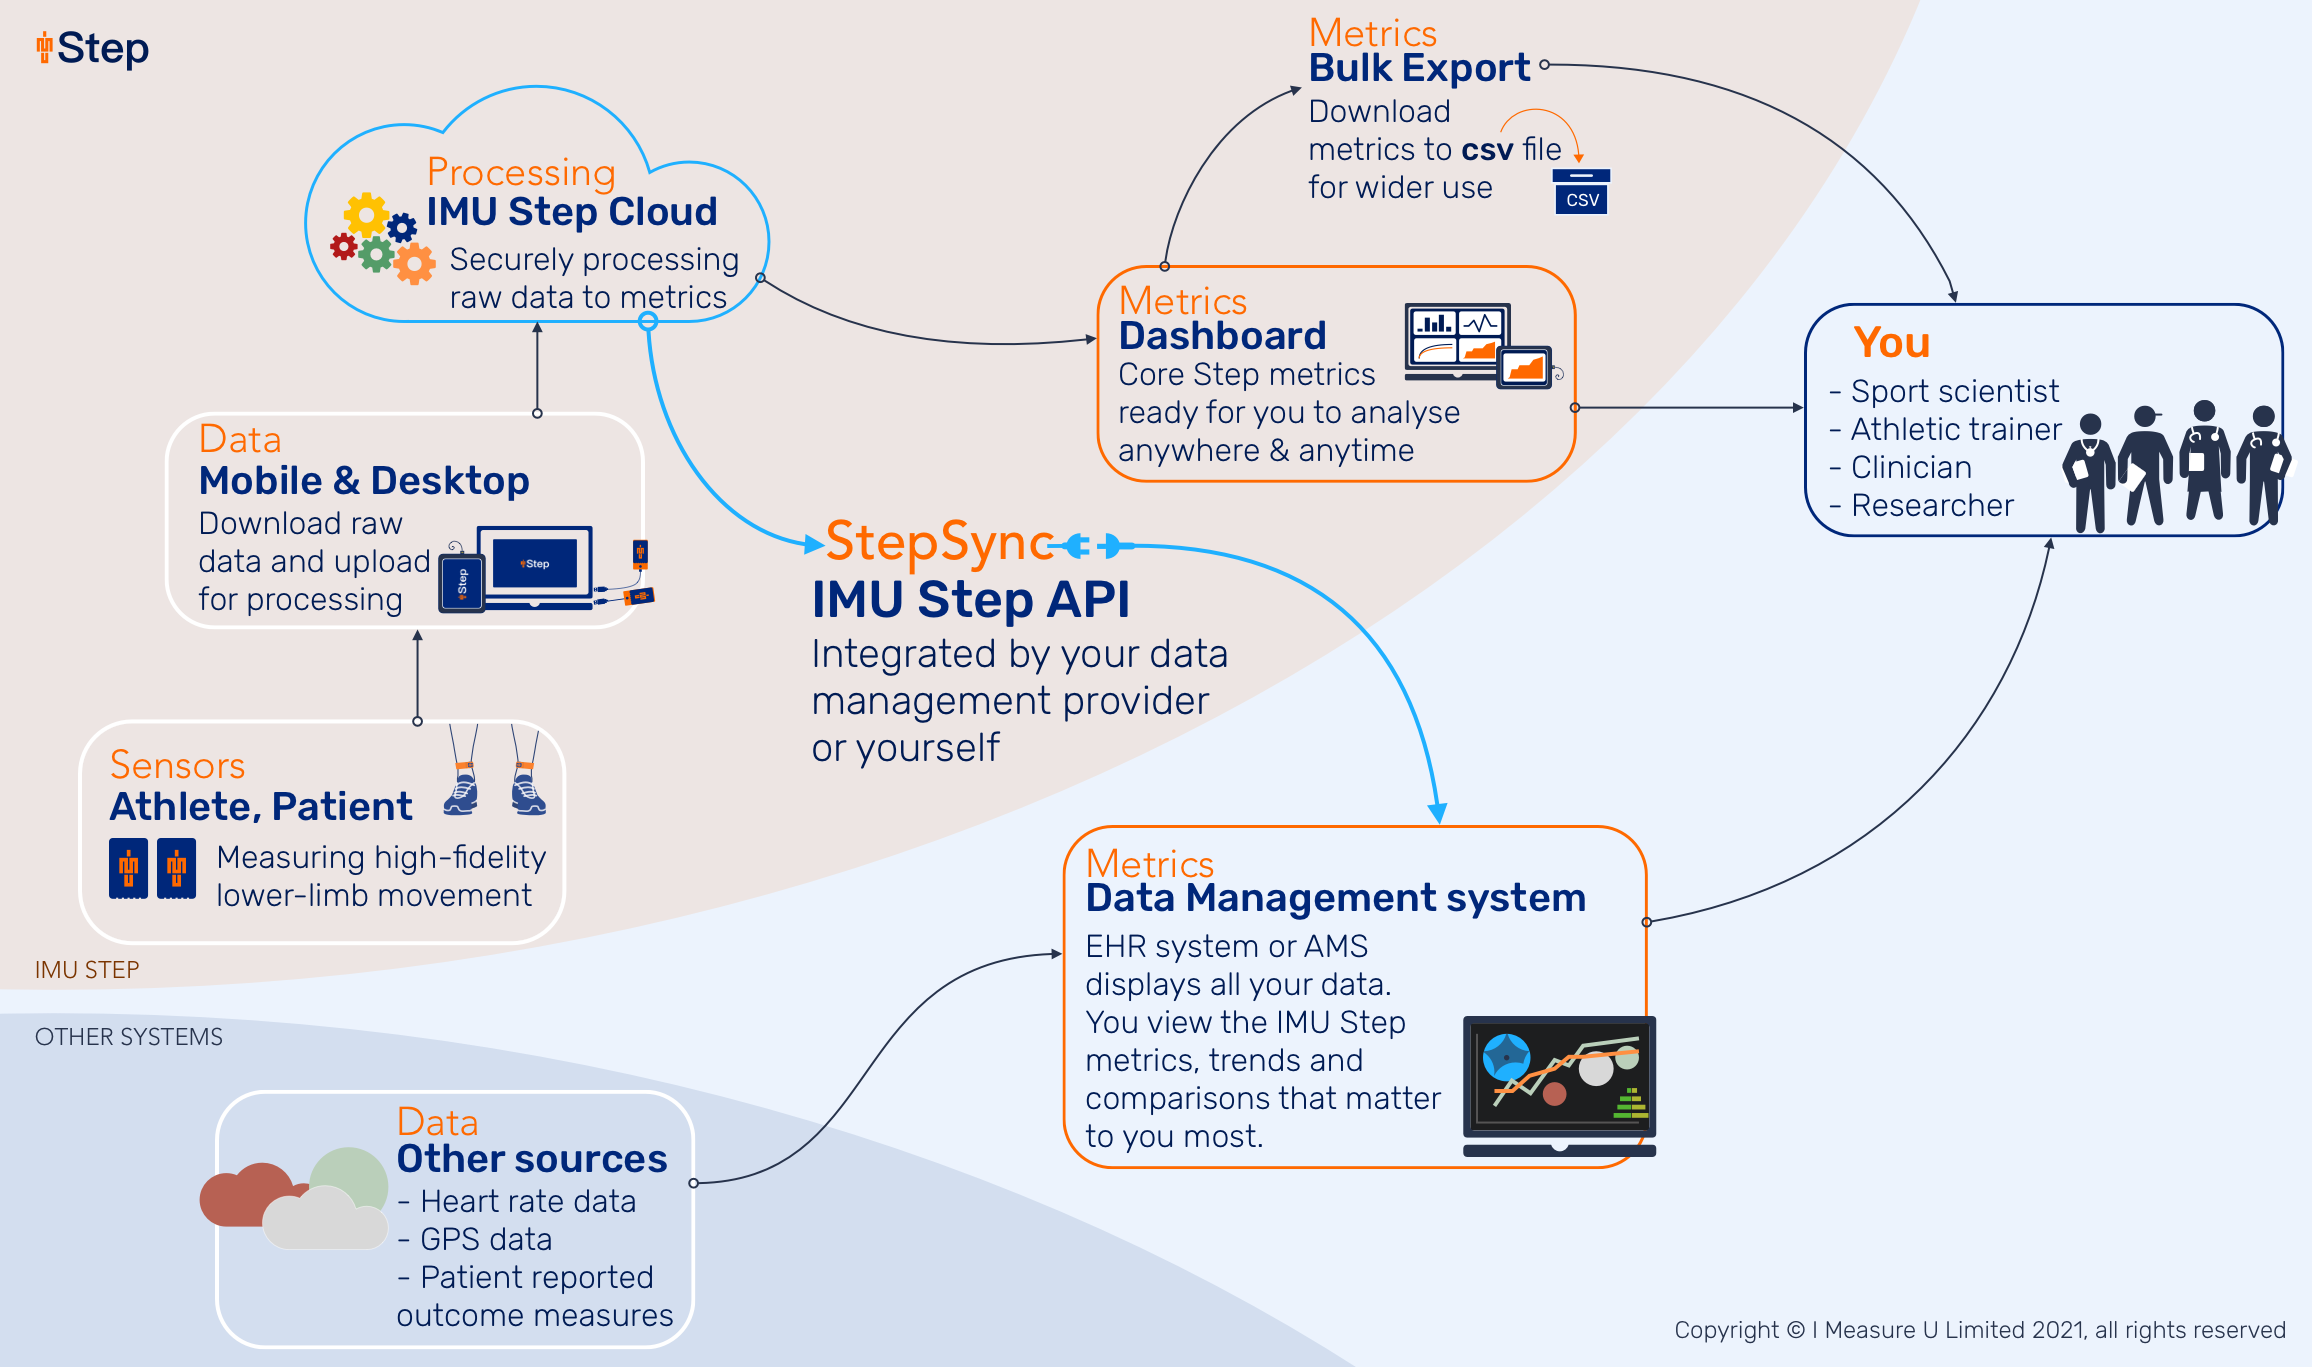
You can retrieve Step metrics from a session, a footnote, or any specific time period you define. This could span minutes, hours, or even days – in the end, the control is yours depending on the custom insights you want to attain.
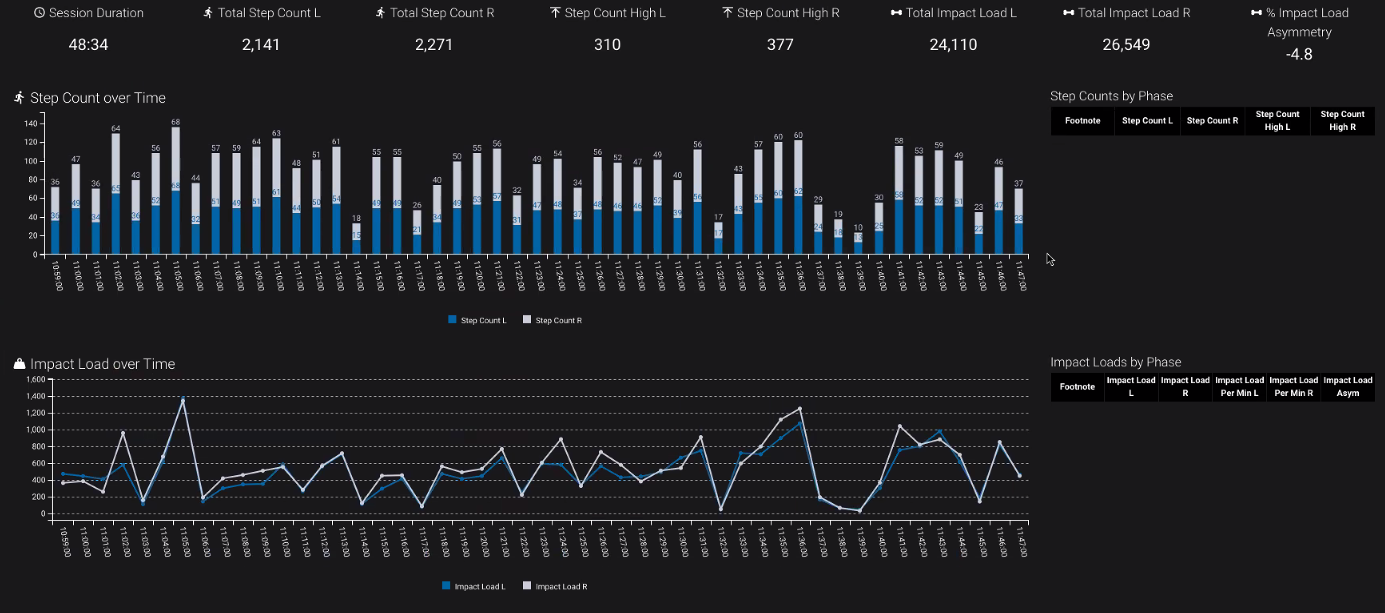
As an example, check out the screenshot below, where an NBA team has imported their Step metrics into their Smartabase AMS. Note how they have graphed Step Count and Impact Load per minute for the Left and Right legs.
Now, this information can be directly compared within Smartabase to any other data they collected at the same time, whether it be from another wearable such as GPS, or subjective measures such as rate of perceived exertion.
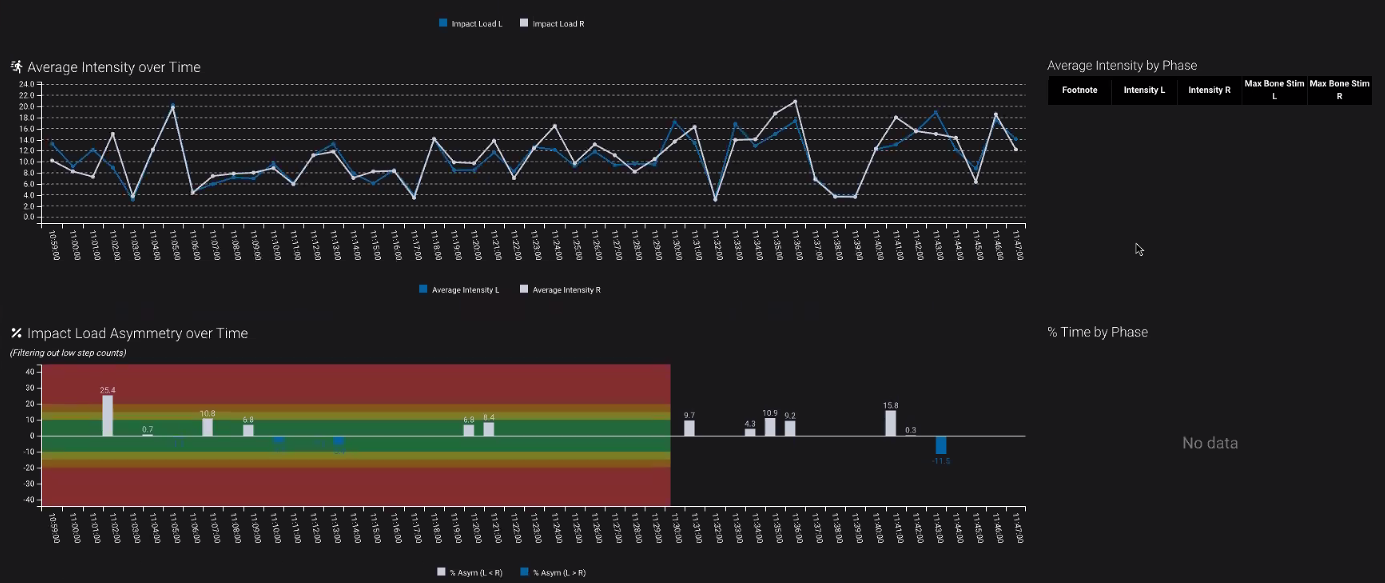
Below is a second example of how this NBA team has decided to plot Impact Asymmetry with their OWN visual representation. Here, they have defined their own custom traffic light zones to make it easier to pick out when Impact Asymmetry of their athlete strays away from the ‘green zone’.
Note that when importing Step metrics, there are a series of flags we use to alert you when we think a data set may require your attention. To get more information on these flags, check out the StepSync Developers Reference Guide.
2. Import Intensity Bin step counts for a Footnote
Want to replicate the Session Asymmetry Graph (or what we like to refer to as the “Christmas Tree”) from our Dashboard in your own management system?
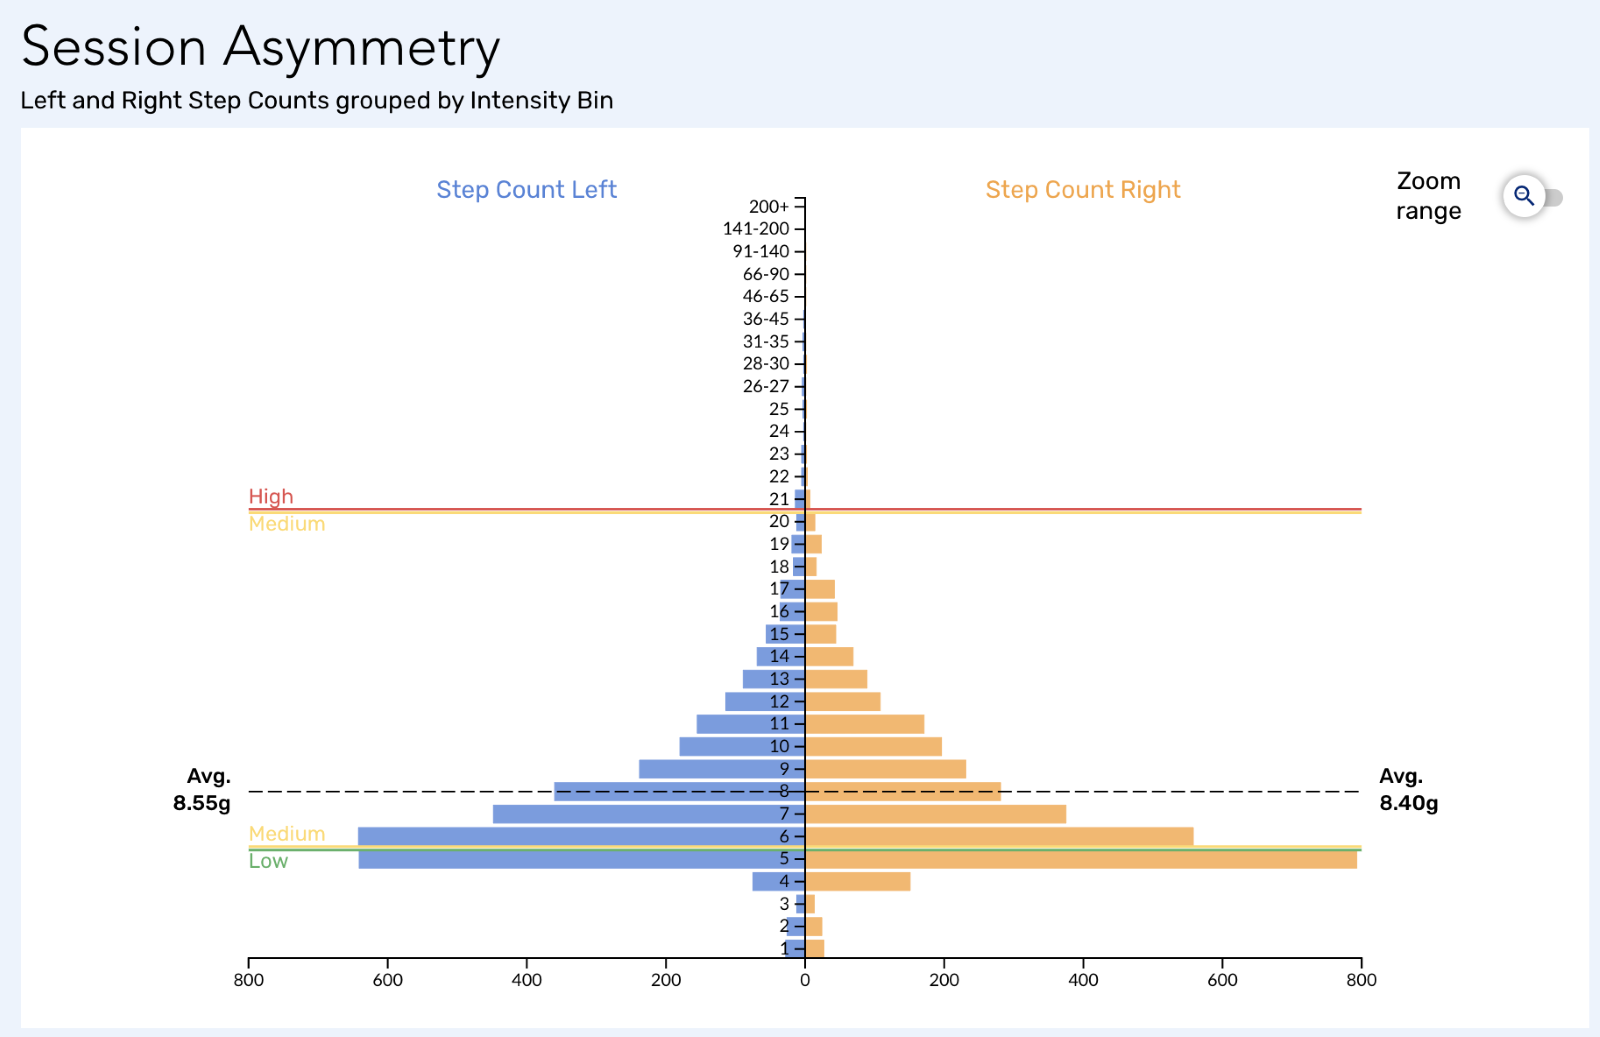
To make this a simple exercise, we have provided a unique object per block of data you pull from the IMU Step Cloud via StepSync. This object is called the ‘Intensity Breakdown’. It contains the number of steps detected in every intensity bin from 1 g through to 200+ g. Simply pull the data and then look at the ‘Intensity Breakdown’ object.
Not only can you replicate the Session Asymmetry Graph from our Dashboard in your own dashboards, but you can create your own custom bin ranges as well. For instance, in the Dashboard, we automatically start grouping impact intensities at 26 g. If you wanted to, you could group your own Asymmetry Graph in any format you like. All you do is request the ranges you want (or no ranges at all) when calling the ‘Intensity Breakdown’ object.
3. Create your own High, Medium, and Low thresholds
Traditionally, we report High (H), Medium (M), and Low (L) intensity steps for you through the IMU Step Dashboard. However, many of our users have asked to be able to make their own custom thresholds, and with StepSync, you can!
If you want to know the number of H, M, and L steps occurring in your own custom thresholds, simply request the ‘Intensity Breakdown’ with the custom grouping of your choosing. This could be in 3 thresholds like we have done, or you could make up 6 of your own – it’s your choice! E.g.: Group by bins 1 – 5 g, 6 – 10 g, 11 – 15 g, 16 – 20 g, 21 – 25 g, 26 – 30+ g.
4. Use external tags to retrieve Step metrics
We know that tagging specific activities during a session is important for quickly identifying the metrics associated with them during analysis. By bringing Step Metrics into your data management system via StepSync, you no longer need to manually footnote or tag in two or more different systems.
If you have tags from an external system such as GPS or a heart rate monitor, you can pull Step metrics during those periods for whenever they occur. By passing in the start time, end time, and the subject or athlete being measured, StepSync will retrieve any Step metrics that happened during that time. Magic!
NOTE: When retrieving IMU Step metrics via StepSync, we recommend doing it for periods that are at least 30 seconds in duration. It is still possible to request data over time periods shorter than 30 seconds, however, StepSync will flag any time periods shorter than this to bring your attention to it. This is because we recommend there be at least 30 seconds of raw IMU data for the IMU Step algorithm to perform to its maximum potential for analysis and yield statistically representative results.
5. Baseline your IMU Step metrics
One of the unique advantages StepSync presents is enabling you to calculate Step metrics across any number of time periods you like (e.g. from 50 different sessions) through your data management platform.
We call this “aggregating data”, and is extremely useful for baselining your IMU Step metrics.
For example, the Impact Load, Impact Asymmetry, or Average Intensity from a particular Session, Activity, or Footnote type that your subject carries out periodically may be of interest when mapping out a rehabilitation journey. By retrieving these metrics via StepSync, and then subsequently aggregating them when appropriate, the following example questions can be posed:
-
Is the Impact Asymmetry for a Footnote from today different to what the average Impact Asymmetry was for the same Footnote over the past month?
-
What are the expected or baseline Impact Load, Impact Asymmetry, and Average Intensity values for an activity type?
-
If Subject A strays away from their mean Average Intensity baseline, by how much have they changed, and why?
In order to answer these types of questions through data trends over time, you have to be able to aggregate your data to get baseline information, which you can do after pulling the core metrics via StepSync.
Below are two tips when baselining or aggregating your IMU Step data in your data management platform:
-
Aggregate base metrics like Impact Load and Step Count before aggregating or calculating other metrics dependent on them (such as Average Intensity or Impact Asymmetry).
-
DON’T fall into the trap of averaging averages. If you want to calculate the average of Average Intensity or Impact Asymmetry across several data sets, bring your calculations back to the first principles of what you are measuring – Impact Load and Step Count.
Example:
The table below contains 2 sessions of IMU Step data I want to average to obtain a baseline. The data from these sessions are outlined below:
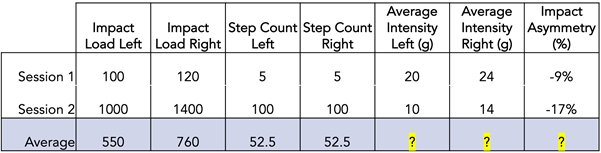
When calculating the mean average of Average Intensity and Impact Asymmetry across two different session objects:
The CORRECT calculations are:
Mean Average Intensity Left:
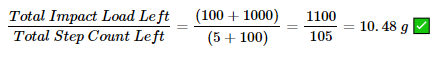
Mean Average Intensity Right:
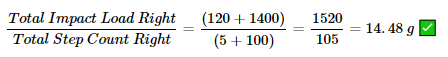
Mean Average Impact Asymmetry:

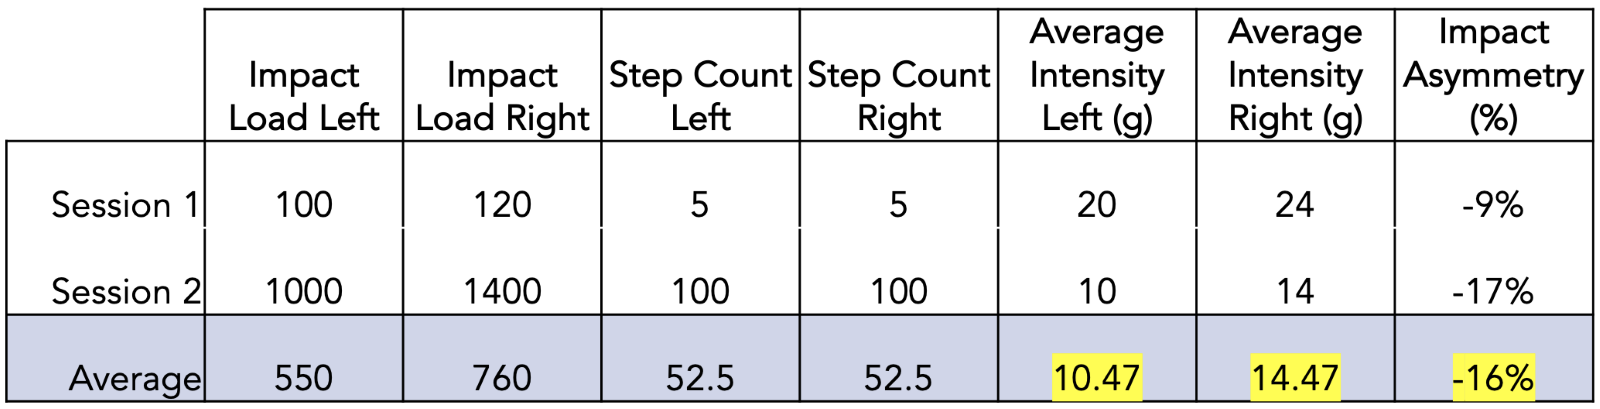
This would leave the table looking like so:
Do NOT fall into the trap of INCORRECTLY averaging averages with the calculation:
Incorrect Mean Average Intensity Left:

Apply the above correct principles when you are baselining or aggregating any data sets, whether they be across sessions, footnotes, or athletes.
Please contact IMU Step Support for any advice regarding the aggregation of metrics. Correctly aggregating metrics and data is important to maintain data integrity.
IMeasureU Support
Comments